3.2 Item information by age
The information for the first set of items, can also be plotted against the age instead of the \(D\)-score (Figure 3.3. This set of items is nicely distributed over the \(D\)-score scale, but over the age range, there are more items that inform the younger ages, compared with older ages. Five items give most information in the first 12 months and only two items inform development in the period between 18 and 36 months. However, these latter items have a wider range of ages where they provide information as shown by the wider range of the curves.
In Figure 3.4, the item information for age of the second set of items is shown. The first six items mostly inform the same age-range (3 to 12 months). In an efficient test, not all of these items need to be included. The two items that inform the older ages, largely overlap too and both inform on development between 24 and 36 months.
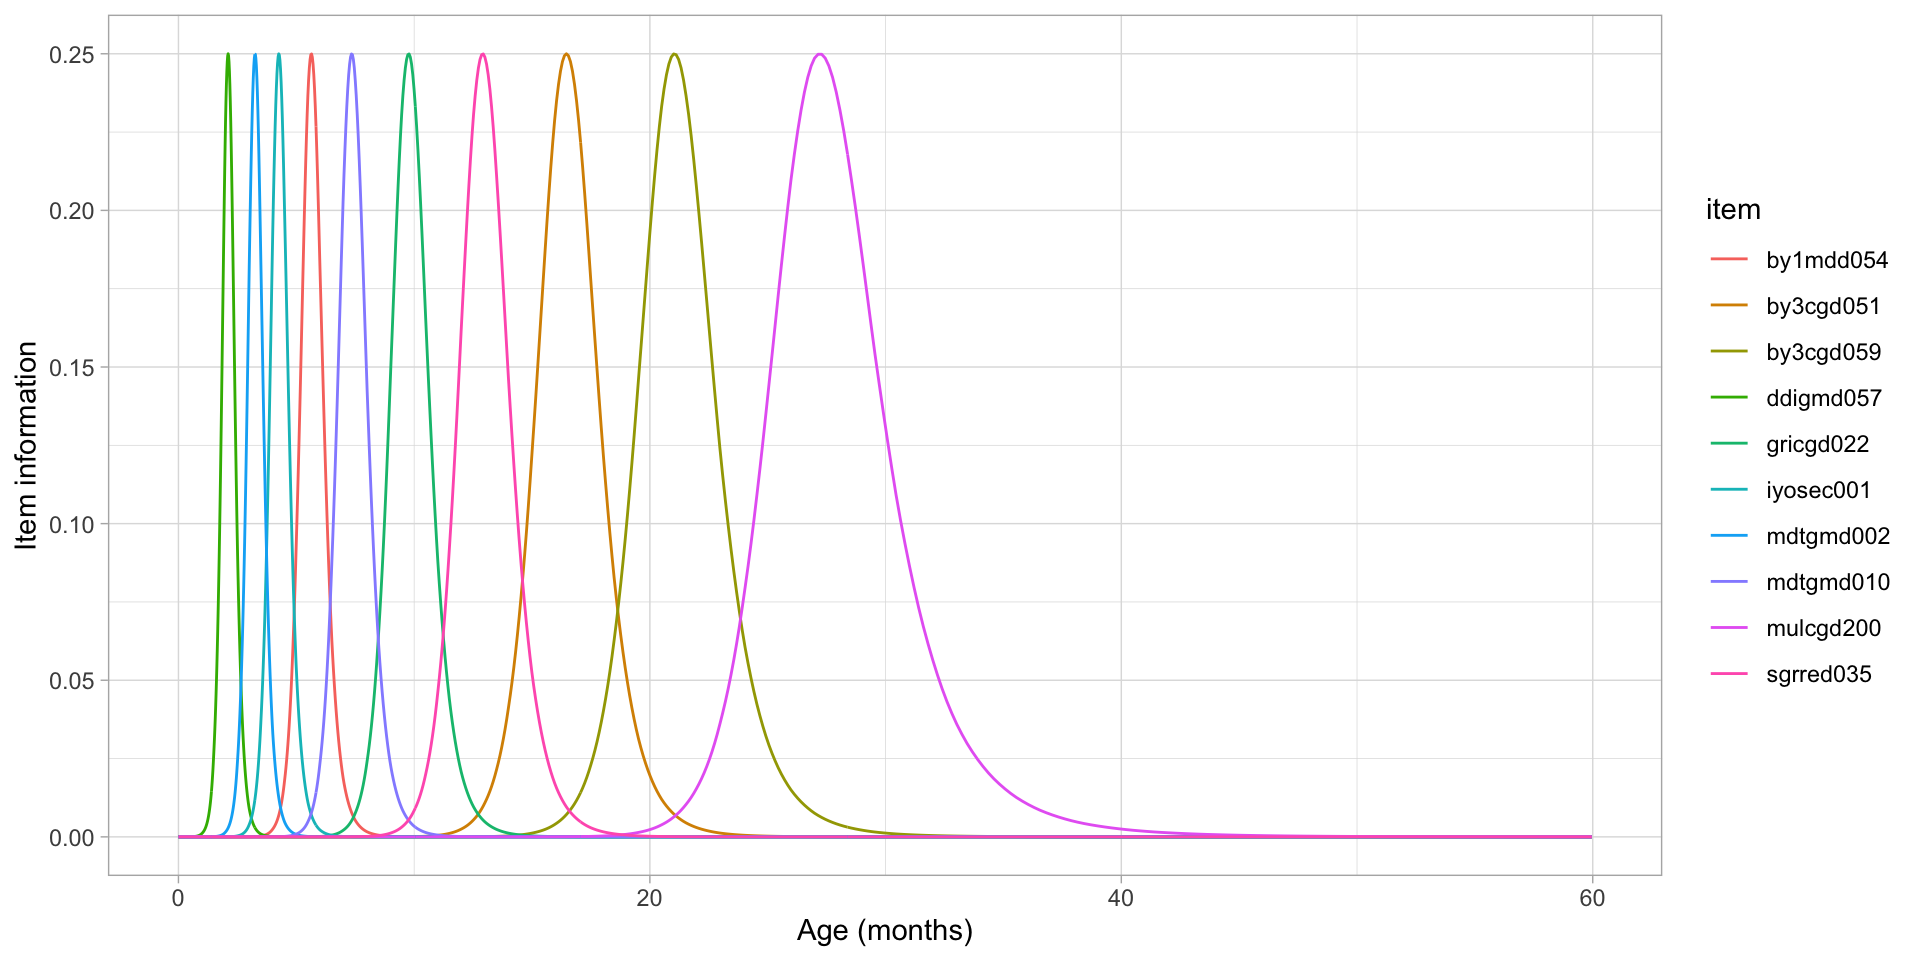
Figure 3.3: Item information by age for a set of 10 items nicely distributed over the \(D\)-score scale.
Warning: Removed 860 row(s) containing missing values (geom_path).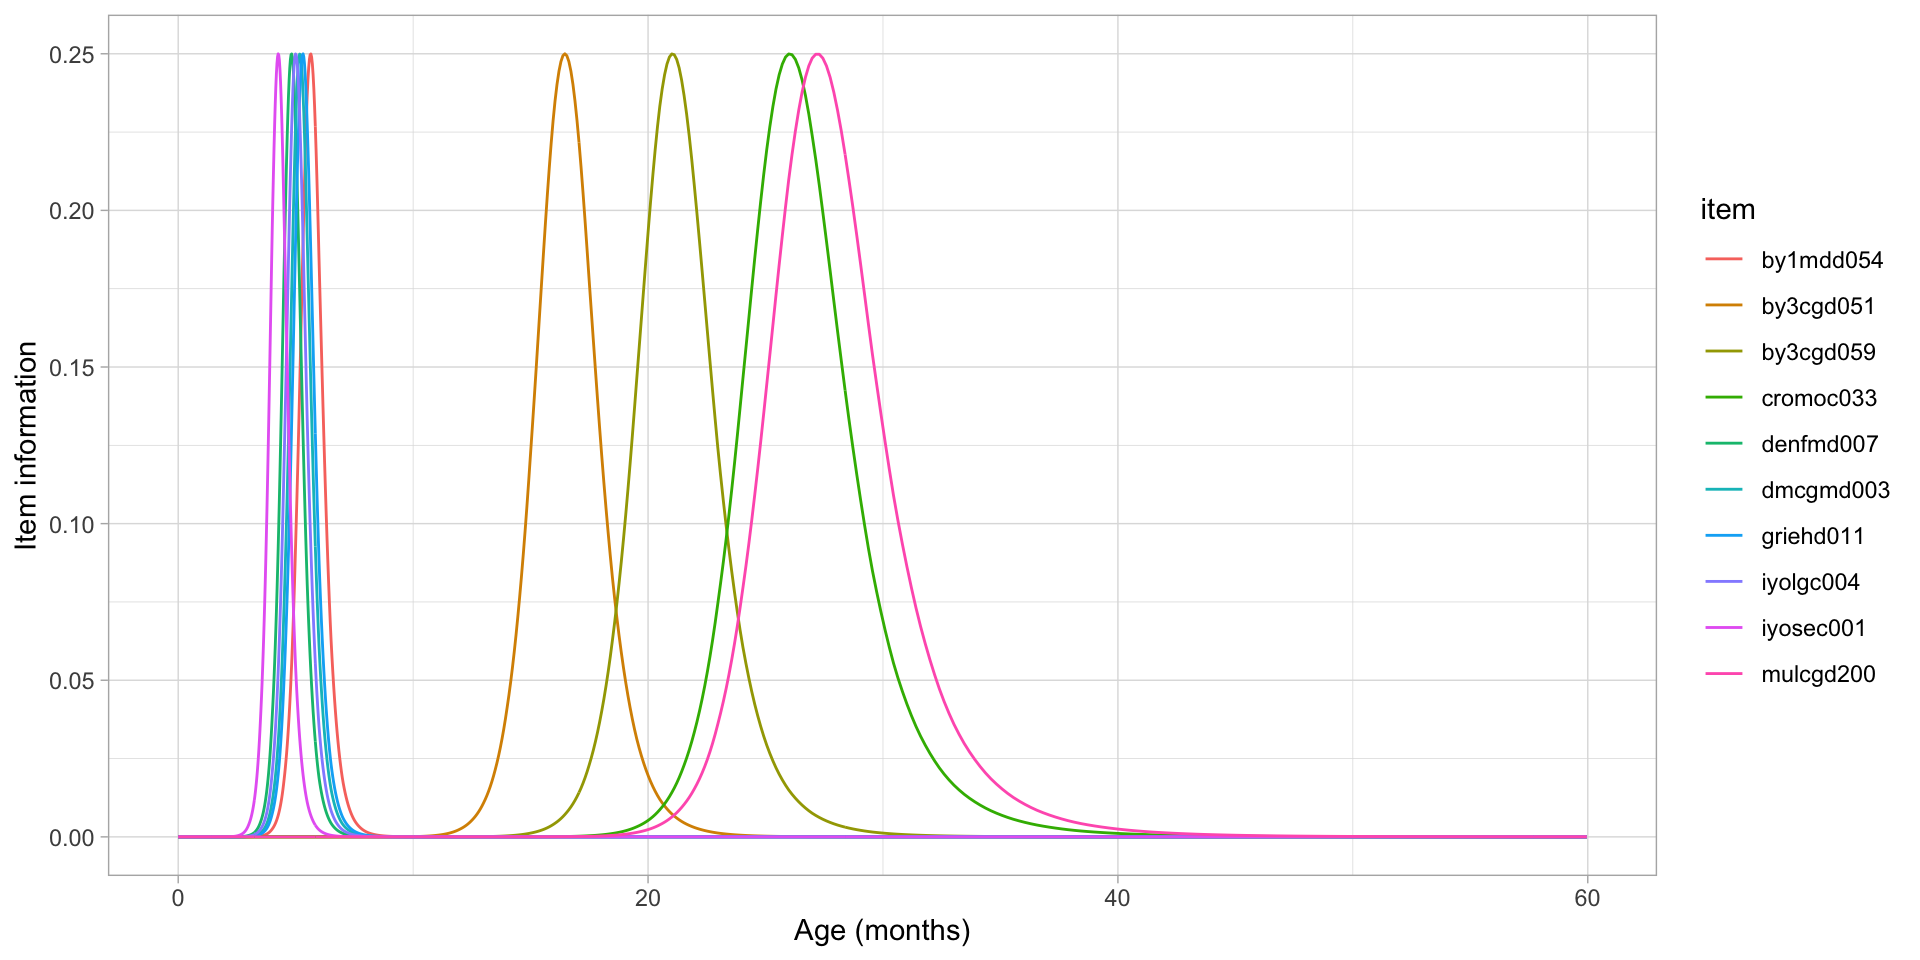
Figure 3.4: Item information by age for a set of 10 items not evenly distributed over the \(D\)-score scale.