Graphical uncertainty representations for ensemble predictions
Abstract
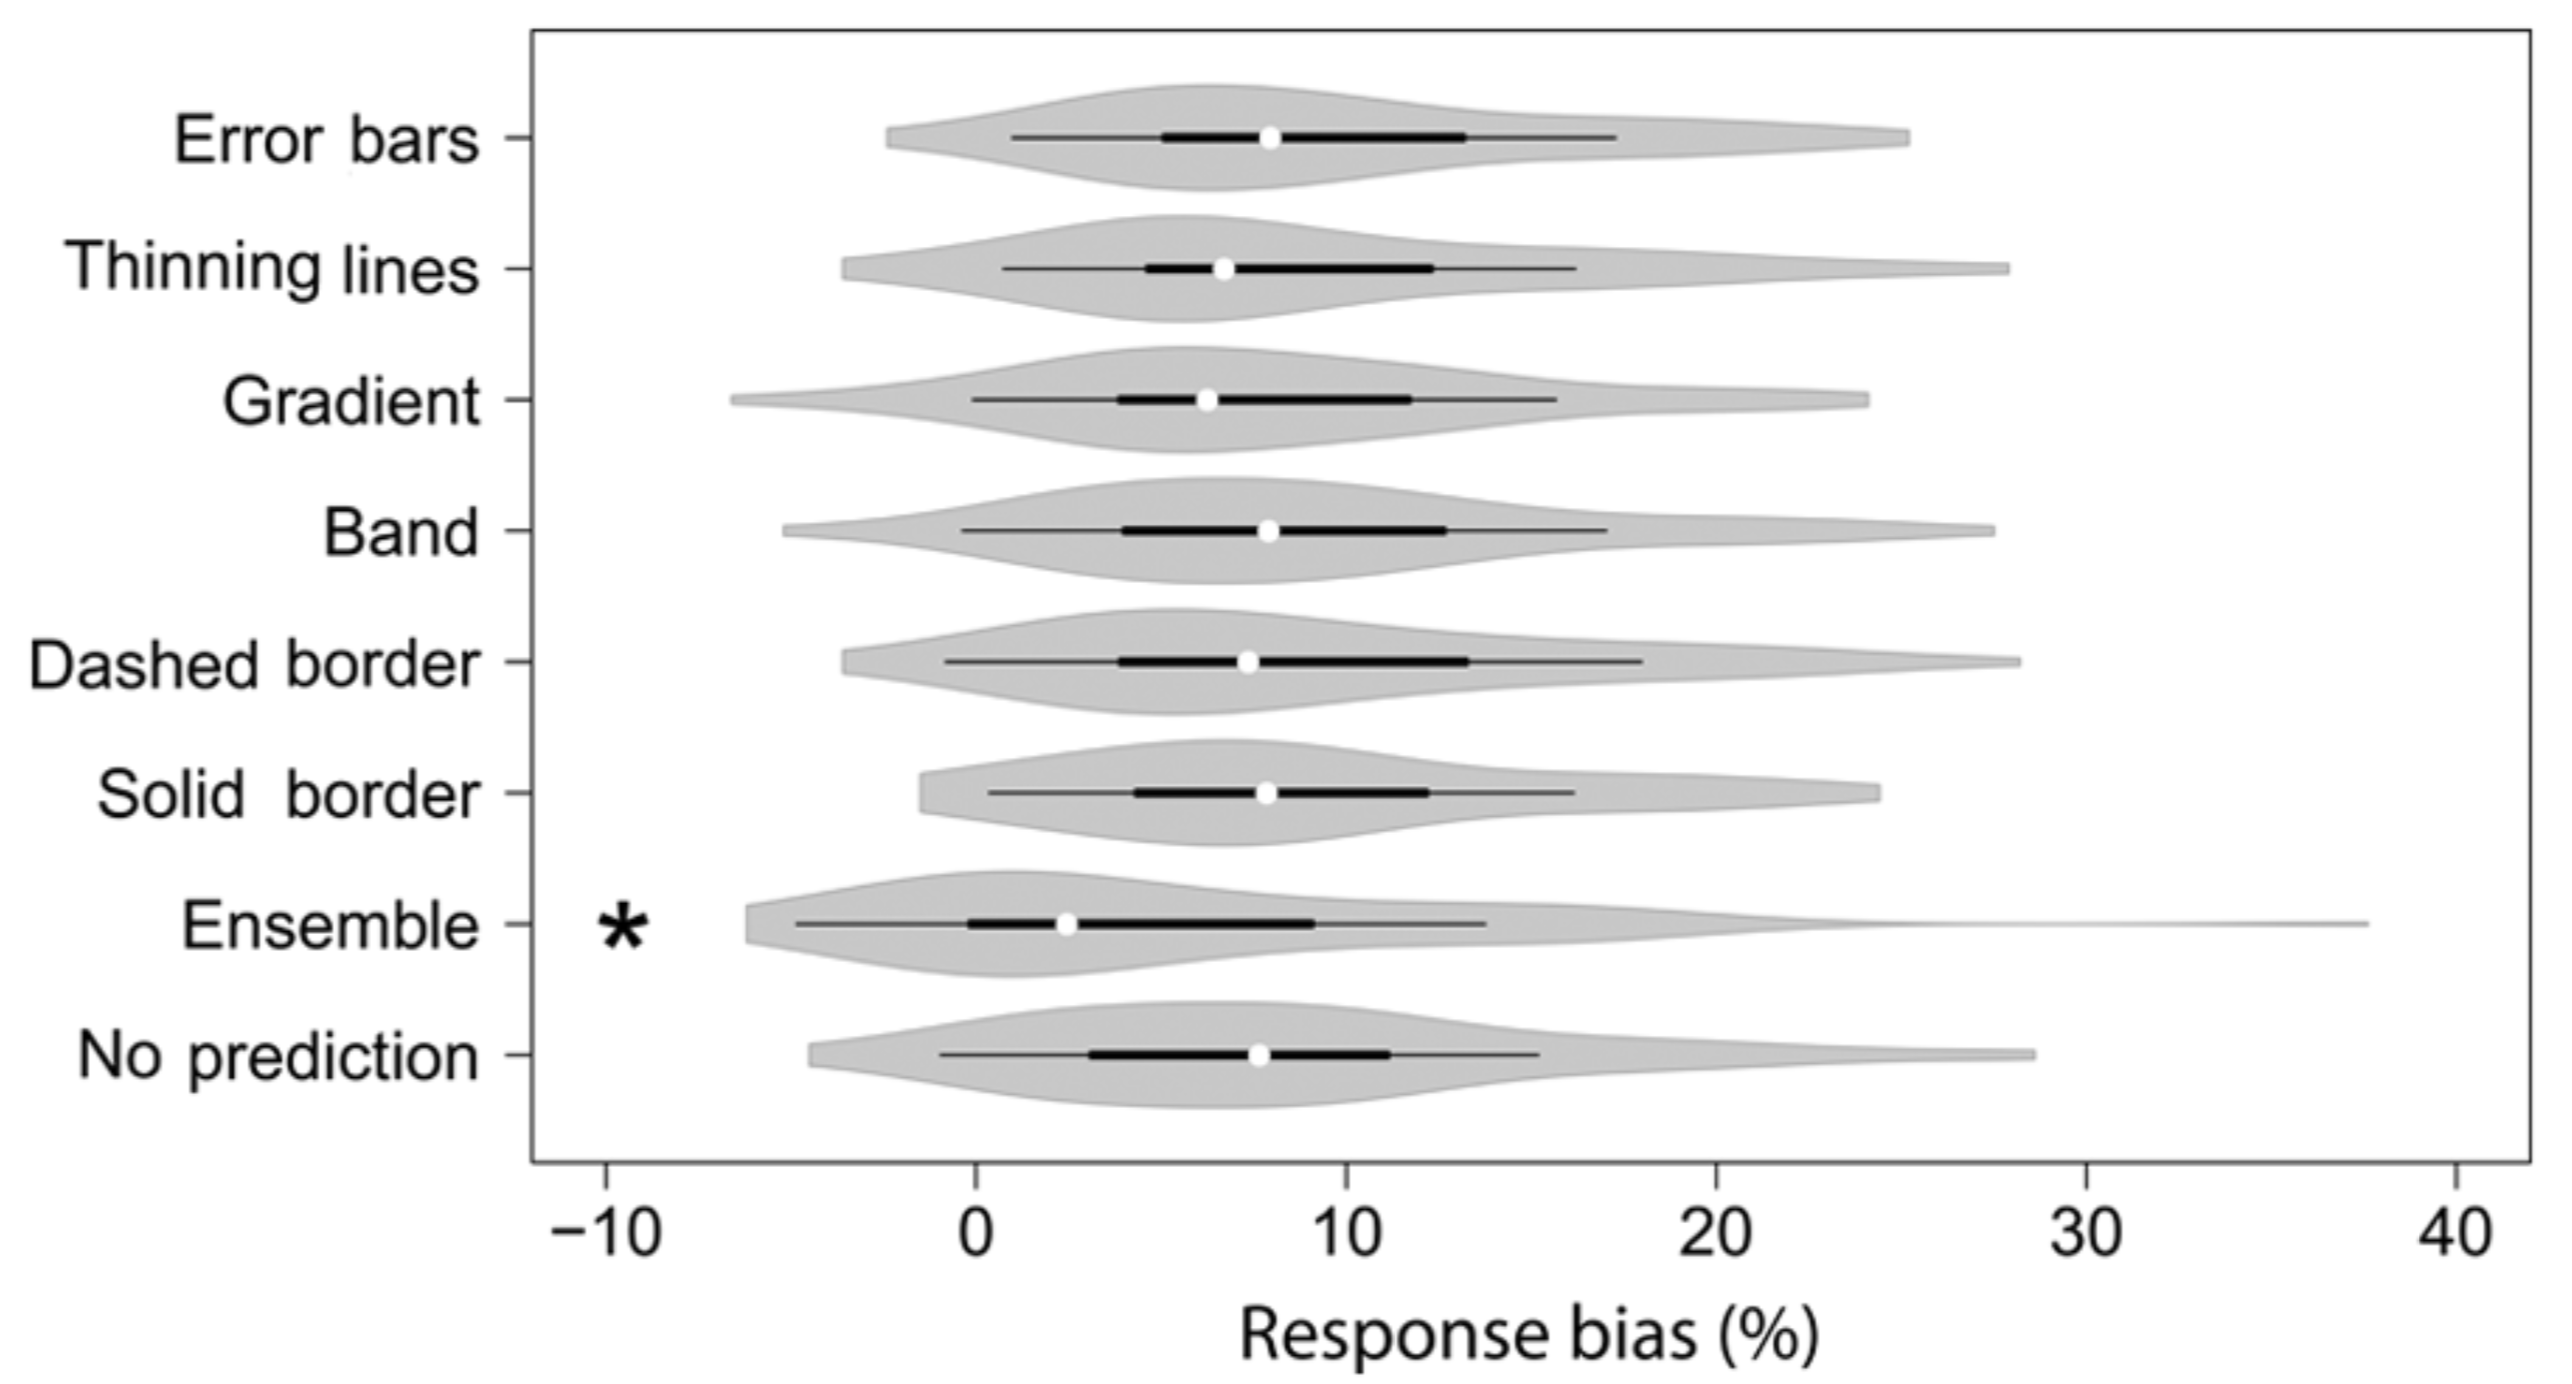
We investigated how different graphical representations convey the underlying uncertainty distribution in ensemble predictions. In ensemble predictions, a set of forecasts is produced, indicating the range of possible future states. Adopting a use case from life sciences, we asked non-expert participants to compare ensemble predictions of the growth distribution of individual children to that of the normal population. For each individual child, the historical growth data of a set of 20 of its best matching peers was adopted as the ensemble prediction of the child’s growth curve. The ensemble growth predictions were plotted in seven different graphical formats (an ensemble plot, depicting all 20 forecasts and six summary representations, depicting the peer group mean and standard deviation). These graphs were plotted on a population chart with a given mean and variance. For comparison, we included a representation showing only the initial part of the growth curve without any future predictions. For 3 months old children that were measured at four occasions since birth, participants predicted their length at the age of 2 years. They compared their prediction to either (1) the population mean or to (2) a ‘‘normal’’ population range (the mean 6 2(standard deviation)). Our results show that the interpretation of a given uncertainty visualization depends on its visual characteristics, on the type of estimate required and on the user’s numeracy. Numeracy correlates negatively with bias (mean response error) magnitude (i.e. people with lower numeracy show larger response bias). Compared to the summary plots that yield a substantial overestimation of probabilities, and the No-prediction representation that results in quite variable predictions, the Ensemble representation consistently shows a lower probability estimation, resulting in the smallest overall response bias. The current results suggest that an Ensemble or ‘‘spaghetti plot’’ representation may be the best choice for communicating the uncertainty in ensemble predictions to non-expert users.